Ian Gregory and Humphrey Southall (University of Portsmouth, UK)
The goal of the Great Britain Historical GIS Project is to create a common framework within which the majority of spatially referenced official statistics published since the early nineteenth century can be integrated, locating this information in time and space. Fundamental to the project is the use of Geographical Information System (GIS) technology, which links the statistical data and the places they refer to. Geographical Information Systems model the world in layers or themes, and so enable us to integrate many datasets collected at different times and published using different administrative units into a common structure. The historian, unlike the contemporary researcher, has limited control over the data they have to work with; but the GIS creates new and powerful ways of manipulating available data to answer previously unanswerable questions.
Many writers in recent years have attempted to provide a definition of GIS. Perhaps the most appropriate definition for this paper is that provided by Goodchild
A GIS is best described as a system which uses a spatial database to provide answers to queries of a geographical nature… The generic GIS can thus be viewed as a number of specialised spatial routines laid over a standard relational database management system.
From this it can be seen that a GIS is in many ways a database management system with a spatial component, usually a computer mapping system, added to it. A GIS therefore contain two types of information: attribute data which are the statistical data, and spatial data providing locations, usually in the form of points, lines and areas (or polygons as they are more correctly called). To create a historical GIS a third type of data, temporal data, needs to be added to this basic model.
Our overview of the historical GIS begins, as did the project, with the attribute database. Almost all of these data came from statistical tables published in nineteenth and early twentieth century reports, and the left hand column in the vast majority of these tables contained the name of some administrative unit, or sometimes a less formal place-name. Computerisation of such material is time consuming but raises few technical issues. However, interpreting the resulting assemblage of information was problematic because so much of the date related to geographical entities which either no longer existed or which had changed their boundaries significantly over time.
One solution to this was to build place-name gazetteers, enabling us to calculate totals for counties and regions from data for low-level units whose names meant little to us. However, the great strength of the data we had assembled was that it provided information not on regions and counties but on sub-county units; on the localities within which people in the past lived their daily lives. In the period before the 1914-18 war, much of our data concerns Poor Law Unions or Registration Districts, areas that were designed to represent a market town and its hinterland. From the First World War to the 1970s a more detailed system of local government districts was used which distinguished urban areas from their hinterlands.
In order to exploit the richness of spatial detail within the database, we began work on the boundary change GIS described in the third section of this chapter. The initial GIS was quite modest, mapping just Unions and Registration Districts, but enabled us to develop a methodology for systematically representing changing boundaries within a computer. This was a crucial methodological breakthrough as it allowed us for the first time to take a dataset from any date and link it to an accurate representation of the administrative units that existed at that date. Creation of this initial system attracted an extensive network of collaborators who supplied additional attribute information, helped fund the project, but wanted a record of changing parish boundaries; about 15,000 units as compared to c. 630 Unions/Districts. We have also been extending the system to include the c. 1,500 Local Government Districts. At the time of writing, parish mapping has been under way for three years but the end is in sight and we hope to be able to present the completed system in August 2000. Work will then proceed to Scotland.
The final section of this chapter outlines the use of the GIS, describing straightforward use for mapping but also outlining the more complex methodologies we have developed for relating datasets gathered for quite different geographies, and for constructing time series for consistent geographical units when the reporting units are constantly changing. This last ability is probably the most important outcome of the project, enabling a wide range of long-term statistical analyses which were previously impossible. One major application is to accurately trace the history of local mortality decline in Britain between the mid-nineteenth century and the present: until now, almost all such research ends at 1911 because the reporting units then changed!
The GBH database holding our attribute data is a large Oracle relational database. What matters is its content and what follows is inevitably simplified; for full details, see our web site:
http://www.geog.port.ac.uk/gbhgis
The origins of the GIS project lie in Humphrey Southall's doctoral research, concerned with the geography of economic distress in pre-1914 Britain, and the origins of the north-south divide which has been a key element of the country's economic, social and political geography throughout the twentieth century. From the end of the First World War onwards, economic distress has been defined primarily in terms of unemployment, and this has been measured through the centrally-managed National Insurance system, created in 1911, under which relief payments to the unemployed were a direct cost to government. Southall's research included an analysis of statistics from the locally-managed and funded Poor Law system, but focused on the records of the mutually-funded and managed welfare benefit systems operated by pre-1914 trade unions. Many historians have used the national totals of the unemployed extracted by the Ministry of Labour and its predecessors, but the figures for individual branches in the original union reports were completely unexplored.
This research was undertaken in the late 1970s with limited computing facilities and no data entry assistance, so the main emphasis was on documenting the statistics and the underlying schemes, which were important but rarely acknowledged forerunners of National Insurance and the modern welfare state. Statistical analysis was limited to particular dates, and to computing unemployment rates for regions and main towns. However, between 1989 and 1991 the Leverhulme Trust funded a new project employing a research fellow, David Gilbert, and a clerical assistant. This enabled us to replace a collection of text files manipulated by Fortran programs with a modern relational database, and to gather far more systematic information from trade union reports and other records of economic distress, constructing a Labour Markets Database (LMDB) for Britain:
A census of Great Britain's population has been taken every ten years since 1801, with the exception of 1941, and although it has been supplemented since c.1970 by several large official sample surveys it is still the most geographically-detailed source of information on Britain's people. The first four censuses were simple head counts, the forms being filled in by knowledgeable officials, most often the parish priest. From 1841 onwards, schedules were completed for each person, including information on age, sex, marital status, occupations and birthplace; and over time an ever-wider range of information has been gathered. Much historical research has been based on the individual information assembled into "enumerators' books", but these remain confidential for a hundred years. Our work aims to systematically link the present with the past, and therefore is based on statistics tabulated in the extensive published reports.
The earlier work on the LMDB included some census occupational statistics, and from 1995 onwards we have assembled further census data transcribed by collaborators; we acknowledge in particular the assistance of David Allan Gatley (Staffordshire) on mid-Victorian censuses and Daniel Dorling (Bristol) on 1951 and 1961. However, in 1998 much larger scale funding from the Economic and Social Research Council (ESRC) enabled us to employ a second team based at the Queen's University Belfast. The Belfast team use a specialised ProLector optical character recognition (OCR) system to digitise printed tables from the census reports. Most recent developments in OCR have emphasised the automated recognition of relatively straightforward office documents, but the ProLector system is highly trainable and performs well with difficult documents: small type faces, varying character shapes and faded ink. The system is still not perfect, but we employ low-cost Information Technology trainees to check and correct the output.
Even with this specialised team, our transcriptions from the census have to be selective, prioritising tables that recur from one census to the next and data for sub-county units, as listed below; many other tables are simple head counts for obscure and specialised administrative units, which we can easily compute from parish-level information once we know their boundaries, but we hope to obtain further funding to remedy the other gaps. Current work is limited to Great Britain, but the Belfast team had earlier completed very extensive transcriptions from the Irish censuses and we hope one day to add mapping of Irish boundaries. Coverage of Scotland is generally limited to data for counties, cities and large burghs.
Much information on numbers, ages and causes of deaths has been assembled from collaborators at the ESRC Cambridge Group for the History of Population and London's Centre for Metropolitan History. However, we have recently obtained substantial funding from the ESRC and the Wellcome Trust to systematically computerise sub-county mortality statistics from 1851 to the 1970s, again working with the Belfast team. When these projects are complete we will hold:
We also have some limited information on levels of sickness, as recorded among the memberships of the Steam Engine Makers' Society 1835-76 and the Ancient Order of Foresters 1872-80; the latter data were supplied by James Riley of Indiana University.
While our holdings of census, mortality and unemployment statistics are intended to become comprehensive, other datasets results from specific research projects or collaborations. These include a database covering all strikes in the Board of Trade/Ministry of Labour strikes register for every fifth year from 1903 to 1938, and another constructed from Burdett's Hospital Yearbooks by John Mohan (Portsmouth). We have access to a large body of electoral statistics for Britain.
We have been exploring the potential to linking the GIS to various pre-census surveys of Britain, although most such datasets are limited to England. In this connection, we have samples datasets supplied by collaborators, generally limited to one or two counties:
More extensive work with these datasets will require significant further funding, but their existence draws attention to the range of systematic spatial data that exists for medieval and early modern England, generally at parish level.
Whatever the source, information in our statistical database relates to geographical entities, and most information relates to formally defined areas. While data for regions and perhaps counties can be interpreted using the researcher's ‘mental map' of Britain, most of our information relates to sub-county units and can be given meaning only through formal linkage to locational information; or put more simply, by being mapped. An enormous range of units might be mapped; the 1871 census report lists information for:
Counties; Parliamentary Divisions and Parliamentary Boroughs; Hides, Tythings, Hundreds, Wapentakes, Wards, etc.; Lieutenancy Sub-Divisions; Petty Sessional Divisions; Police Divisions; Highway Districts; Local Board Districts; Boroughs and Towns with Improvement Commissioners under Local Acts; Civil Parishes and Townships, and Extra-Parochial Places; Military Districts and Sub-Districts; Post Office Districts; Inland Revenue Districts; Poor Law Unions; Registration Districts and Sub-districts; Census Enumeration Districts.
However, most of these units had specialised functions. In practice, two or three principal geographies can be distinguished, as shown in figure 1:
Figure 1: Principal Statistical Reporting Units in England and Wales, 1911
All three geographies used parishes as building blocks, except in urban areas where an entire town might be a single parish but sub-divided for vital registration and elections. The parish was an ancient ecclesiastical unit, but the modern Civil Parish system was created only in the 1860s, i.e. after the first censuses and after the New Poor Law, and then very extensively modernised by the Divided Parishes Acts of 1876 and 1882. All three geographies were organised at a higher level into counties, but these are a source of considerable confusion. Firstly, PLUs/RDs aggregated into Union or Registration Counties which often differed substantially in area from the Ancient Counties of the same name, while LGDs aggregated into Administrative Counties which were generally closer to the Ancient Counties. Secondly, while most counties existed as Ancient, Registration and Administrative Counties, albeit with differing boundaries, the lists of units varied with the Soke of Peterborough, East and West Sussex and so on existing as distinct administrative counties.
However, the largest single problem is not apparent from examining names of districts that appear in our statistical tables, or even a single set of maps: the boundaries of Registration Districts, LGDs and the individual parishes were all subject to constant change. As discussed below, the census reports and other statistical sources include lengthy but little read lists of these changes. However, systematic and accurate interpretation of the main statistical tables requires not merely that we read these lists; we must establish what effect each change had on our map. Given the tens of thousands of boundary changes that occurred, the only possible way of assembling this information is within a computer, via a Geographical Information System.
Geographical Information Systems technology has developed to meet the needs of marketeers and utility companies, not academic research, and available commercial software makes little provision for incorporating a time dimension. Some historical mapping projects have side-stepped this problem by creating a sequence of static maps, and this could have been done for Britain if we were only interested in the boundaries as they existed at particular dates, such as those of the censuses, or if we were interested only in boundaries which changed only through infrequent revisions, as with the constituencies used in parliamentary elections. However, we needed to study bi-annual Poor Law data and three-monthly mortality statistics, and the boundaries of Registration Districts and LGDs were subject to a constant trickle of small changes.
Our approach was therefore based on a single GIS ‘master coverage' within which all features, both boundaries (‘arcs') and units (‘polygons'), were date-stamped with a start-date and an end-date. This enabled us to deal with the four main types of boundary changes:
Although some changes were more complicated, such as an existing area being abolished and a new area with new boundaries created at the same time, all types of change can be built up from these four elements.
We might have implemented a date-stamped dynamic GIS by writing a bespoke temporal GIS system from scratch. The dangers of this approach are well-illustrated by the Great American History Machine, who followed this approach. Their aim was to include all US census data and their associated boundaries in a single software package, but this important resource has never been properly published essentially because of delays in removing relatively minor ‘bugs' from the software. We therefore based our system on existing GIS software, the well-known ArcInfo package, with bespoke software being written in Arc Marco Language (AML) to manage changes over time. One particular strength is that ArcInfo provides comprehensive tools for integrating its spatial data with attribute data held in an external database management system such as Oracle.
Like most GIS software packages, ArcInfo stores its data in distinct coverages. Each coverage holds information on a single theme or layer of data. A coverage will usually consist of either points, lines (technically termed arcs) or polygons. A point coverage might represent churches or hospitals, while an arc coverage could represent railways or rivers. In both cases the spatial features would have attribute data linked to them. The data model ArcInfo uses to represent polygons consists of a combination of points and arcs. Arcs represent the boundaries of the polygon, with their attributes holding information about the boundaries, to represent the polygon itself points (termed label points) are used and data attached to the label point are allocated to the entire polygon. This feature is crucial to the way that temporally referenced spatial data can be stored as it allows us to store the temporal data, in the form of date-stamps, about a unit (attached to the label point) separately from the temporal data about its boundaries (attached to the arcs). We can therefore store the changing state of an administrative unit for many dates in a single coverage, termed a master coverage, and extract an accurate representation of the unit for any required date. The date-stamping for the four types of changes listed above can then be incorporated as described below:
For ease of data management the decision was taken that the three major types of unit would be stored in separate ArcInfo master coverages. This involves some duplication of data but greatly simplified the construction process and also has the advantage of speeding up the extraction of data, particularly for Unions/RDs and LGDs, by reducing the volume of data that features are to be extracted for. The minor differences between Unions and RDs were handled using attributes. Two fields were added to the attribute tables of both the arcs and label points for the Union/RD coverage. One was used to flag whether the area was a Union, and the other whether it was an RD. In this way only the appropriate feature could be selected.
The attributes for the LGD system were very similar to those for the Union/RDs. Attributes specific to Unions/RDs were not needed, while a new attribute was added to the label point attribute table indicating the type of area a label point represents: County, Municipal, or Metropolitan Boroughs, or Urban or Rural District. Where a unit changed its status, such as a Municipal Borough becoming a County Borough, a second label point was needed, as with name changes, but with the type field rather than the name field differing.
This section focuses first on map-based sources of boundary information, and then on textual sources describing boundary changes. A single series of maps had to be used as the core source for digitising to which the boundaries for other dates could then be added. The choice of which series of maps to use for core digitising was obviously of key importance: it had to be for a suitable date, at a scale that would allow complete digitising of the country, and based on a projection system that would allow counties to be joined together easily. It was decided to use a series of half-inch to the mile (1:126,720) Ordnance Survey (OS) county administrative diagrams published between 1906 and 1910 for the following reasons:
Figure 3 shows an example from this series. The figure uses grey-scales however the original series was published in colour. The thick light line near the edge of the figure shows the boundary of Newport Poor Law Union, named in large letters. Both the boundary and the letters are dark red on the original. The darkly shaded unit (pale red on the original) in the centre of the map is the County Borough of Newport and the lightly shaded units (beige) are Urban Districts. Although there are no Municipal Boroughs in this example they are shaded pale blue on the series. The remainder of the Union, as bordered by the thick dark boundaries (dark blue), has been divided into the Rural Districts of St. Mellons and Magor, although this is slightly unusual. The thin lines (again red) mark parish boundaries, showing clearly that the larger areas are aggregations of these.
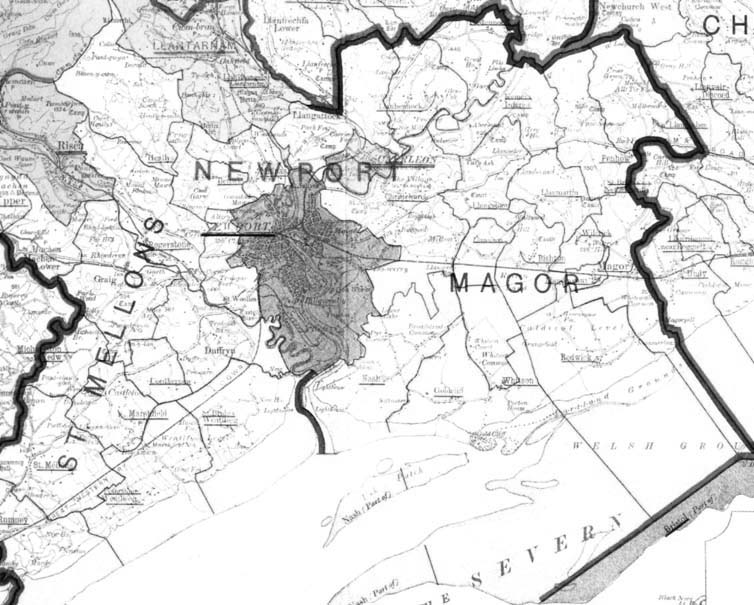
Figure 3: Sample of the "County Administrative Diagrams" of 1906 to 1910:
The Newport area of Monmouthshire
Maps showing post-1911 changes are abundant, as the county administrative maps were revised and published at regular intervals of approximately once a decade until after local government reorganisation in 1974. Prior to the 1906 to 1910 series however, source maps are more problematic as large scale surveying and mapping of the country was an ongoing process over the nineteenth century. The OS produced its first map in 1801 but did not become significantly involved in large scale mapping of administrative boundaries until the Survey Act of 1841. This resulted in the country being surveyed at 25 miles-to-the-inch (approximately 1:2,500), a process that was not completed until 1893 due to Yorkshire and Lancashire, initially surveyed at 6 miles-to-the-inch (approximately 1:10,000), being re-surveyed at the larger scale. The fact that this re-surveying work was not completed until the 1890s has serious implications for boundary research as most maps showing administrative boundaries were derived from these surveys, so earlier maps are sparser and lack detail.
There is a series of "Diagrams of Sanitary Districts" for the late 1880s showing Boroughs, Sanitary Districts, Unions, and Civil Parishes but at the smaller scale of four miles to the inch (1:253:440). Another source is a set of half-inch to the mile Index sheets to the 1:2,500 maps published around 1900 that show civil parish boundaries but as these are index sheets they are difficult to work with. The General Registrar Office (GRO) had access to a series of maps compiled from contemporary one-inch to the mile OS maps which were cut up into a separate map for each Registration District. The outline of each Registration District was highlighted in red with the boundaries of Sub-Districts added in pink and civil parishes in blue. These maps were used by the GRO for administrative purposes as they contain notes explaining boundary changes. They are now held in the Public Record Office (PRO) in RG.18/198-829. These provide information about boundaries for the late 1880s and early 1890s.
For earlier years a different set of maps was used. These were listed in the PRO Index volumes as showing the parish boundaries in 1870 and are in PRO class RG.18/1-73. They are a series of OS one inch-to-the-mile sheets, probably from editions published in the early 1850s, and were not cut up in the manner of the 1891 maps. They show Registration Districts and Sub-Districts, but the units shown probably do not date from 1870, in fact several of the boundaries of Registration Districts appear to be those of 1851. The fact that many of the boundaries have been updated by hand on these sheets suggests that they remained in use for a long period after they were published. Unfortunately, this series was only around 80% complete and where there were gaps yet another series of maps, this time in PRO IR.105/2-74, had to be used. These maps were produced quickly for the Registrar General to show civil parishes as reference material for the 1851 census. They are one-inch maps marked up with tithe districts on the sometimes incorrect assumption that these were the same as parishes.
A major problem with these two earlier series is that, due to the slowness of large scale surveying of northern England, only ancient parish boundaries are marked north of a line between Preston and Hull. As there were major differences between ancient parishes and townships, which became civil parishes in the north, this means that many boundaries were never accurately recorded. A second problem, particularly prevalent in the East Midlands, occurs where there were no tithe boundaries marked. In either cases, either the 1888 sanitary district maps or, in exceptional cases, first series six-inch maps were used. The final series of maps used were the least satisfactory. These were included as sketch maps of Registration District boundaries in the published reports of the 1851 census. Their scale, however, was only 12.5 miles to the inch (nearly 1:800,000) and the detail and accuracy provided was far more limited than any other sources used. These were only used in the creation of the Union/RD system when there were insufficient resources to visit the PRO on a regular basis.
Although maps are the most useful source of spatial information, they only provide snapshots of boundaries at certain dates. Researching the information required to create the date-stamps involved using textual description of boundary changes. These were available in similar formats for the three main types of units giving the name of the area loosing territory, the name of the area gaining territory, a description of the area affected, and an exact date of the change. In some cases data such as the population and area affected are also given. Information on changes to Registration Districts has generally come from the Annual Reports and Decennial Supplements of the Registrar General, changes to LGDs were taken from the Annual Reports of the Local Government Board and its successors, and changes to parish boundaries are included in the printed census reports from 1881 onwards. An example of these lists, taken from the Registrar General's Decennial Supplement for the 1890s is shown in figure 4. Changes from the other sources follow a similar structure.
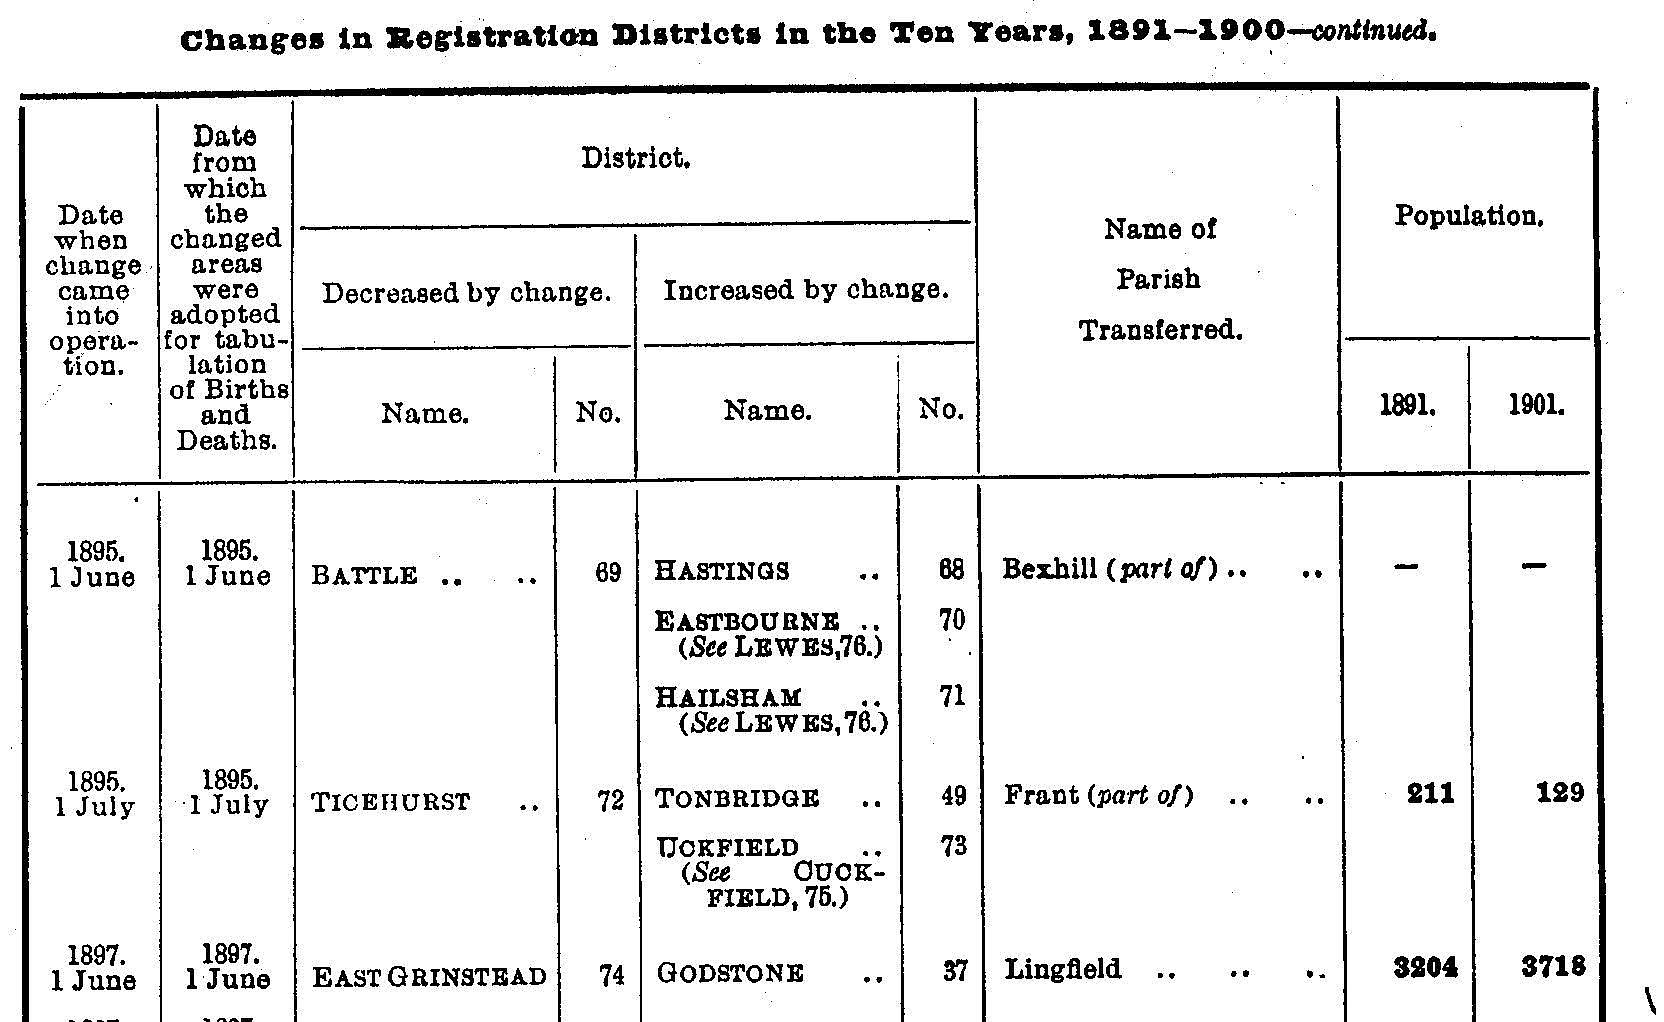
Figure 4: Example of boundary changes list from the Registrar
General's Decennial Supplement, 1901
We have built a large database of boundary changes from these reports, giving a brief description of individual changes with precise dates and the relevant legal instrument. This now contains 383 changes to Poor Law Union and Registration District boundaries, 5,874 changes to LGDs boundaries and 26,944 changes to parish boundaries. These changes range from the transfer of a few acres and a few people from one area to another, to entire areas being created or abolished with over 100,000 people being affected.
Combining the map and text based sources provided the information to create the full time-variant GIS. Construction proceeded county-by-county in the following stages:
Although the boundary change GIS is a potentially valuable resource for administrative historians, its main function is to give meaning to our statistical database. The simplest application is, of course, the creation of choropleth and other thematic mapping, but we are developing more sophisticated methodologies, especially for the analysis of long-run change.
The initial justification for the historical GIS was the analysis of historical unemployment or poor relief statistics, and a conventional way of presenting such information is a choropleth map, in which areas with high percentages of unemployed workers or paupers have a darker shading than those with low percentages. Creating such a map with the GIS involves two stages: firstly, creating the appropriate coverage for the source and date; secondly, linking the statistical data to the coverage via a gazetteer.
The master coverages described above contain all the boundaries that existed at any time within the period covered, stored as lines or ‘arcs' rather than as polygons. To create a map which can be linked to data, we must:
This process is computationally demanding, taking approximately two minutes for a Union/RD or LGD coverage on a Sun Sparc Station 20 with 133MHz processors.
The second stage is to link the newly created polygon coverage to the statistical data. Although ArcInfo comes with its own database management system, this has a number of limitations and all our statistical information is held in a separate Oracle relational database management system (RDBMS). ArcInfo includes a ‘Database Integrator' module providing access to data stored in an external RDBMS, so the remaining problem is not technical but substantive: our statistical tables are, as far as possible, direct transcriptions of historical sources, containing place-names rather than numerical identifiers; and place-names sometimes have complex relationships with places.
One problem is that a given place may go by a number of slightly different names: Newtown or Newton or Newton-le-Willows; St. Helen's or St Helens or Saint Helens. This problem is relatively easily dealt with by a gazetteer which matches the alternative versions of the name to a single standardised form that appears in the GIS (but it needs to include every possible way of writing St Helens!). The other problem is that a given name may be associated with a number of different places. This is not a problem with county names, affects a relatively small number of Registration Districts, and is widespread with parish names. In general, historical sources attempt to avoid ambiguity by mentioning higher level units, most often counties, but sometimes we need to guess the right place from the wider context, and parishes whose names are duplicated within a single county raise fundamental problems. Note that these two forms of ambiguity interact: ‘Newton-le-Willows' is an unambiguous location, but ‘Newton' is very common.
Building a gazetteer for Poor Law Union names, linking all the combinations of union name and county that appeared in the database with an unambiguous label used in the GIS, was a day's work. However, building a gazetteer containing all the variant names of the 15,000-plus parishes in England and Wales has proved a significant project in itself, but the resulting resource has a number of other uses. Firstly, it has to associate each parish with the higher level units it was part of; but this means the gazetteer can be used to assemble parishes together into maps of those higher level units. Secondly, it serves as a geographical thesaurus aiding resource discovery: users searching for information on, say, the county of Rutland can be directed to the town of Oakham, and vice-versa. Thirdly, the final gazetteer will necessarily contain a great deal of information about Britain's changing geography, especially when linked to our large database of changes, and could form the basis for an important reference tool in its own right.
One critical aspect of this is in mapping information for earlier periods. There is very little information about boundary changes before the mid-nineteenth century, and in fact most earlier mapping projects have used late nineteenth century base maps with much earlier sources; for example, Darby's well-known Domesday Geography used the 1888 maps discussed above to map 1086 data. However, we can greatly increase the usefulness of the GIS as a tool to aid in the interpretation of pre-1851 data by extending our gazetteers, to include earlier versions of parish names and, in particular, earlier hierarchies of units: the ecclesiastical system of deaneries, arch-deaconries and dioceses; and the ancient civil system of hundreds and ancient counties. The latter, however, is complex as hundred boundaries sometimes sub-divided parishes, while some early sources relate not to parishes but to vills or manors. We will be extending our gazetteer system by drawing extensively on F. Youngs' Local Administrative Units of England, the most authoritative source.
Any number of sample maps could be included to demonstrate the potential of our system, but figure 5 shows population growth or decline in Wales during the 1900s at parish-level.
Figure 5: Parish-Level Mapping: Population change in Wales, 1901 to 1911
The GIS can be used as a very powerful analytical tool in its own right, and we are investigating analytical methodologies of specific relevance to historical research:
NB in all of this work, the principal output from the GIS is not a map but a new set of statistical data to be used in further analysis.
Lastly, while new statistical methodologies may advance academic knowledge, they influence popular understanding and political decision making rarely, slowly and indirectly. New methods for presenting our work, to students and to the ‘general reader', are just as important. Another part of our work has explored how best to present our work to a wide audience so as to develop understanding of how long-run socio-economic change and demographic processes have influenced the geography of modern Britain. In this research, we explored how best to combine established tools for cartographic visualisation, creating static images on paper, with multimedia technologies for the creation of animations and three dimensional landscapes. One aspect of this project was the creation of a complete on-line atlas, viewable on the web. This was based closely on an existing paper atlas, the Atlas of Industrialising Britain, and staying with the existing text limited the multimedia formats we could include:
http://www.geog.port.ac.uk/aib
The historical GIS has been developed, first in London and now in Portsmouth, as a research resource for use by the project team and their extensive network of collaborators. However, the operational GIS is not publicly accessible, and wider academic access is through our dissemination partners, who are funded by the Joint Information Systems Committee to provide a service to the UK higher education community (researchers from outside the UK are not automatically entitled to assistance, but are still advised to contact them, possibly through their own national data archives):
http://hds.essex.ac.uk/gbh.stm
Obviously, having on-line statistics at one site and on-line boundaries at another means that at present users must request two separate downloads, and then carry out analyses and draw maps on their own computer. However, more sophisticated services including on-line gazetteers are being discussed.
It is hard in a single paper to present all aspects of a large project involving many staff at several sites, plus a wide network of collaborators. The large task of mapping changing parish boundaries is almost complete, but full exploitation of this resource will take even longer. What we hope is clear is how our core GIS containing administrative boundaries is not simply enabling various historical researchers to map their data, but is serving to integrate together a very wide range of information about Britain's past. The project will certainly provide academic researchers, and especially quantitative historians, with data permitting quite new analyses of truly long-term social, economic and demographic change. Our new challenge is how best to make this information available to many different communities of potential users:
The research described here covers Great Britain, and we hope to extend it to Ireland. However, we are also interested in linking together similar projects in other countries, partly to share experience but also to explore the potential for linking together national projects to create an electronic map of Europe. With financial support from the European Science Foundation, we are organising a specialist workshop in Florence in June 2000, and then reporting its conclusions at a workshop session within the International Congress of Historical Sciences in Oslo. Also in Oslo, we will be presenting some initial findings from our mortality research, and demonstrating the historical GIS in the exhibition area.
© Ian Gregory and Humphrey Southall April 2000